
The global economic landscape is currently marked by moderate growth and easing inflation, though it remains fraught with risks and uncertainties. According to the latest World Economic Outlook from the IMF, global growth is projected to be around 3.2% in 2025. This figure is slightly below the historical average, reflecting challenges such as high central bank policy rates, fiscal tightening, and low productivity growth.
Inflation is expected to continue its downward trend, with global headline inflation projected to fall to 4.4% in 2025. However, the balance of risks remains tilted to the downside, with potential threats including geopolitical tensions, commodity price spikes, and persistent inflationary pressures.
Policymakers face the dual challenge of managing the final descent of inflation while ensuring fiscal policies are sustainable and rebuilding economic buffers. Structural reforms and efficient multilateral coordination are also crucial for promoting productivity growth and mitigating the effects of climate change.
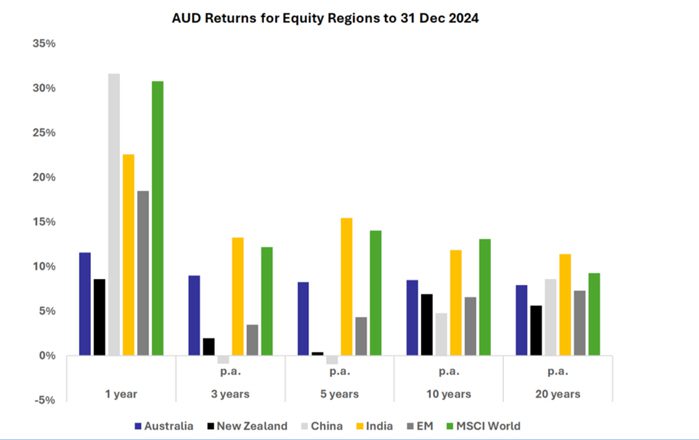
In 2024, markets defied expectations of over-valuation in the US, India, and other select countries,performing exceptionally well. A stimulus-driven surge in the Chinese equity market during thesecond half of the year significantly boosted emerging market (EM) returns. India, now accountingfor 20% of EM, also played a crucial role in this positive outcome.
The US markets, representing nearly 75% of the MSCI World Index, had a substantial positive impacton global developed market investors, especially those invested in the “Magnificent 7” tech giants.The tech sector continues to drive growth and employment in the US.
As we enter 2025, investor caution is rising due to high valuations in regions like the US and India. Incontrast, Australia and New Zealand, while less expensive, are experiencing lower earnings growth.China stands out as an anomaly, with the potential for a stimulus-driven rebound and currentlytrading at low valuations.
India is projected to be the fastest-growing major economy in 2025, with GDP growth expected to be around 6.5% to 6.6%. This impressive growth relative to other regions, is driven by a robust middle class, sustained investment, and strong consumer spending.
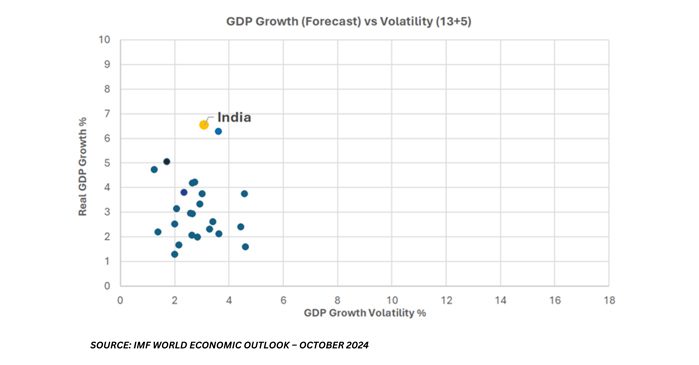
SOURCE: IMF WORLD ECONOMIC OUTLOOK – OCTOBER 2024
| Population | Median Age | GDP-per-capita | Urbanisation | |
|---|---|---|---|---|
| India | 1457M | 28.8 | $2,698 | 37% |
| China | 1417M | 40.1 | $12,969 | 68% |
| Usa | 346M | 38.3 | $65,000 | 83% |
| Australia | 27M | 38.0 | $61,300 | 86% |
India’s significant and youthful population provide a favourable demographic backdrop for rising GDP per capita. This will occur through rising productivity through better logistics and infrastructure, rising urbanisation and skilled employment.
Significant opportunities exist in technology, renewable energy, infrastructure and manufacturing. The country’s focus on sustainability, electric mobility, and artificial intelligence will be crucial for future growth. The services sector, particularly ICT-led innovation, will also play a vital role.
INFLATION AND INTEREST RATES
India’s inflation dynamics are indeed interesting. With headline CPI at 5.5%, it’s at the higher end of the Reserve Bank of India’s (RBI) target range, largely due to a recent spike in food prices, which is expected to be cyclical. Core inflation, however, is more stable at 3.6%.
Given the cyclical slowdown, the RBI might consider cutting rates in early 2025 to support the economy. Meanwhile, India’s 10-year bond yield has been falling, now at 6.88%, which is close to its 25-year average and 57 basis points lower than its peak in June 2022. This decline in yields could indeed be conducive to faster growth, and any rate cuts would likely help maintain momentum during this cyclical weak spot.
Currently the market size of India’s pharmaceuticals is approximately US$63bn. According to a recent EY FICCI report, it is estimated to reach US$130 billion in value by the end of 2030 (and US$450bn by 2047). Additionally, India has the 3rd highest market share by volume in the global market for pharmaceutical products, which has already exceeded US$1 trillion.
THRIVING INDUSTRIES
The IT Services industry contributes close to 7.5% to India’s GDP. The industry generates US$250bn, with a significant part coming from exports and creating employment for over 5.5 million people. By 2030, this is expected to grow to US$350bn, with a further 2 million jobs to be added. India holds a significant position in the global IT services industry.
As of recent estimates, India accounts for approximately 55% of the global market for IT services. This dominance is driven by a combination of factors, including a large, skilled workforce, cost advantages, and strong governmental support. The country’s IT services sector continues to grow, with increasing demand for digital transformation, cloud computing, and software development services.
GENERIC PHARMACEUTICALS
India’s has built an enviable industry in manufacturing of generic pharmaceuticals. This expertise has been built over the last 20 years and is leading to rising market share globally. The industry is being driven by:
- Government support for operational plants which have added capacity to supply the world. During the pandemic, India established itself as a leading exporter of generic pharmaceuticals and vaccines. As a result, India is well-positioned to see significant export growth.
- The largest number of FDA-approved production sites outside of the US. India has registered 376 facilities with the FDA for FY2024, including 200 Active Pharmaceutical Ingredient (API) facilities, 134 Finished Dosage Form (FDF) facilities; an
- An upcoming patent “cliff”, with at least 16 blockbuster drugs coming out of their patent periods. India’s economic scale, number of scientists and production capacity make it one of the cheapest locations for manufacture in the world. This places India’s generic pharmaceutical exporters in a strong position to gain market share.
Tariffs
Since his victory, Trump’s tariffs have been much talked about. They will have a potential negative impact on India. However, India’s trade with the US only stands at US$76bn, relative to its almost US$4tn economy. Its imports to the US include gems and jewellery, pharmaceuticals, petroleum products, electrical and electronic goods, engineering products, apparel, and marine products.
Food Prices
India continues to face challenges when it comes to food price volatility, driven byweather/monsoon. Food is close to 45% of India’s CPI basket and is responsible for India’s recentstubborn inflation, which can have a significant impact on the spending power of Indians.
Foreign Direct Investment (FDI)
India remains an attractive region for foreign direct investment. In FY24, India received US$71bn,which was slightly lower than peak flow in FY22 of US$85bn. This is not ideal as FDI is crucial inpromoting growth, increasing employment, participating in infrastructure projects, integratingglobally and benefiting from technological advancements.
Employment
The official rate of unemployment is 8%. There is a high proportion of informal employment and under employment. This is due to the structural shift from agriculture to manufacturing and services, which has limited job creation in high-productivity sectors due to skill mismatches. The Government’s focus in this term will be to develop skills, create incentives for start-ups and result in more productive employment.
VALUATION
| FY25 | FY26 | FY27 | |
|---|---|---|---|
| Consensus Earnings Expectations (Dec 23) | 1079 | 1210 | - |
| Consensus Earnings Expectations (Dec 24) | 1067 | 1214 | 1359 |
| Earnings Downgraded | -1.1% | +0.3% | - |
| P/E at 23,645 (Dec 24) | 22.2x | 19.5x | 17.4 |
| PEG ratio | 1.4 | 1.4 |
SOURCE: BLOOMBERG CONSENSUS
India’s Nifty-50 is trading on valuations of 19.5x (15 months ahead), which is not dissimilar to its forward valuation over the last 10 years. However, interest rates have risen globally, and equity market volatility has risen since 2022. Small and mid-cap valuations are also high after a strong period of performance in 2021 and 2023-2024.
Earnings growth, which has been running at above 20% CAGR since 2021, is now normalising towards a run rate of 10-15% going forward. The recent correction of 10% in the Nifty-50 over the last quarter has led to more reasonable valuations. Certain stocks, however, have tumbled closer to 20-30% if not backed by earnings growth

We anticipate India’s GDP growth for FY25 to be around 6%, influenced by restrictive interest rates, weak consumer spending, and reduced government spending post-election. While PMIs suggest some moderation, they remain comfortably above 50, indicating expansion. Earnings are expected to improve in the latter half of FY25 as government spending and consumer demand increase. The RBI may consider interest rate cuts as inflation stabilises.
The current market pullback presents a good entry point for investors, particularly over the March quarter. This is especially relevant for those without exposure to India or those looking to increase their investment in India’s structural growth story. The pullback in Mid and Small-Caps has created opportunities in industries such as Shipping, Pipes, and Agri products. Our Fund remains overweight in Pharmaceuticals and Information Technology stocks while being underweight in Financials, Energy, Materials, and Consumption stocks.
For more analysis and information, please visit our website www.indiaavenue.com.au Also follow us on LinkedIn: India Avenue Investment Management: Company Page Admin | LinkedIn

DISCLAIMER
This Note (‘Note’) has been produced by India Avenue Investment Management Limited (‘IAIM’) ABN 38 604 095 954, AFSL 478233 and has been prepared for informational and discussion purposes only. This does not constitute an offer to sell or a solicitation of an offer to purchase any security or financial product or service. Any such offer or solicitation shall be made only pursuant to a Product Disclosure Statement, Information Memorandum, or other offer document (collectively ‘Offer Document’) relating to an IAIM financial product or service. A copy of the relevant Offer Document relating to an IAIM product or service may be obtained by writing to us at IA@indiaavenue.com.au or by visiting http://www.indiaavenue.com.au. Note does not constitute a part of any Offer Document issued by IAIM. The information contained in this Note may not be reproduced, used, or disclosed, in whole or in part, without the prior written consent of IAIM.
Past performance is not necessarily indicative of future results and no person guarantees the performance of any IAIM financial product or service or the amount or timing of any return from it. There can be no assurance that an IAIM financial product or service will achieve any targeted returns, that asset allocations will be met or that an IAIM financial product or service will be able to implement its investment strategy and investment approach or achieve its investment objective.
Statements contained in this Note that are not historical facts are based on current expectations, estimates, projections, opinions and beliefs of IAIM. Such statements involve known and unknown risks, uncertainties and other factors, and undue reliance should not be placed thereon. Additionally, this Note may contain “forward-looking statements”. Actual events or results or the actual performance of an IAIM financial product or service may differ materially from those reflected or contemplated in such forward-looking statements. Any trademarks, logos, and service marks contained herein may be the registered and unregistered trademarks of their respective owners. Nothing contained herein should be construed as granting by implication, or otherwise, any license or right to use any trademark displayed without the written permission of the owner.
Certain economic, market or company information contained herein has been obtained from published sources prepared by third parties. While such sources are believed to be reliable, neither IAIM nor any of its respective officers or employees assumes any responsibility for the accuracy or completeness of such information. None of IAIM or any of its respective officers or employees has made any representation or warranty, express or implied, with respect to the correctness, accuracy, reasonableness or completeness of any of the information contained in this and they expressly disclaim any responsibility or liability, therefore. No person, including IAIM has any responsibility to update any of the information provided in this Note.
Neither this Note nor the provision of any Offer Document issued by IAIM is, and must not be regarded as, advice or a recommendation or opinion in relation to an IAIM financial product or service, or that an investment in an IAIM financial product or service is suitable for you or any other person. Neither this Note nor any Offer Document issued by IAIM considers your investment objectives, financial situation, and particular needs. In addition to carefully reading the relevant Offer Document issued by IAIM you should, before deciding whether to invest in an IAIM financial product or service, consider the appropriateness of investing or continuing to invest, having regard to your own objectives, financial situation, or needs. IAIM strongly recommends that you obtain independent financial, legal and taxation advice before deciding whether to invest in an IAIM financial product or service.