
Australian domiciled investors seeking diversification by investing abroad to gain exposure to different economies and currencies through their listed companies on overseas equity markets. Given their level of knowledge of foreign companies is generally lesser than companies listed on the ASX, this task is generally outsourced to an active manager, focused on outperforming an Index like the MSCI All Country World Index (ACWI) or an ETF seeking to replicate the performance of this or similar index.

Source: MSCI
Observing the significant weight to the US market in the ACWI, most investors who have a balanced, growth or high growth risk profile, tend to have significant exposure to Australian equities and US equities in the growth component of their diversified portfolios. The Australian component is largely due to home bias and a taxeffective dividend structure, whilst the US component is largely a legacy of the strong performance of the S&P500 over the last 15 years since the GFC.
Active vs Passive
For active minded investors the focus is generally on outperforming the MSCI ACWI through portfolio construction. If this is outsourced to a group of asset managers who are focused on the appropriate regional allocation and stock selection, then as an investor you are usually looking for outperformance which correlates with the philosophy, style and process of the asset management firms selected. Passive investors generally focus on keeping costs low and hold a view that a market-cap weighted index is hard to outperform. They may also seek to implement their own views through smart-beta or thematic ETF’s.
For the purposes of this note, we focus on actively minded portfolio constructors, who seek to create a portfolio that can outperform the ACWI.
Building a Global Equity Portfolio for Outperformance
One of the key thematics being explored by investors constructing exposure to global equities is the performance of listed companies in emerging market (EM) countries. Today most investors continue to allocate to EM managers, benchmarked to the MSCI EM, as a ‘satellite’ option to generate greater outperformance. This is based on the belief that the expected GDP growth of these EM economies as an aggregate is usually forecast to exceed growth expectations of developed market (DM) economies.
However, the “last period bias” of many investors will leave most feeling that EM has always underperformed expectations, particularly over the past 15 years. Over this period, EM as an asset class have had many false starts, luring investors to allocating an overweight position relative to the (EM weight in the) ACWI, in an effort to generate outperformance.

The chart above though indicates that there can be periods of significant outperformance (i.e. 2003-2008, where specific EM exposure can add value to a portfolio, relatively to purely DM only portfolio. 2003-2008 was a period where the USD fell from a peak (2003) and led to investors (particularly from the US) to allocate to EM in a ‘bucket’ type approach, using broad based EM managers to gain exposure to strong economic growth and appreciating currencies in these economies.
Fast forward to 2023…
Post 2016, a period of de-globalisation emerged which has led some investors away from bucket style allocations to broad EM strategies, as economic and market performance has shown greater dispersion due to protectionism, trade-wars, the pandemic and geopolitics. The economic and equity market performance of regions like China, Turkey, Brazil, Middle East and Russia have shown great dispersion at times.
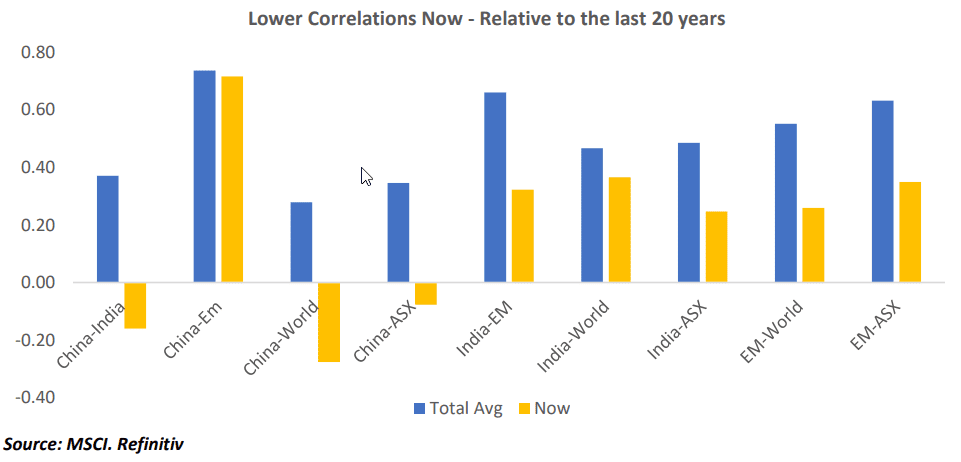
Under these circumstances, diversity sought through correlation benefits can be lost in a de-globalised world when aggregated strategies are considered over more less correlated themes / regions. The orange bars reflect the falling correlations over the last three years, as opposed to structural correlations measured over the last 20 years (blue bars). This perhaps points to a more ideal environment to select a region with strong structural growth, with correlation benefits when building a more optimal diversified portfolio.
Quite often investors seek to invest in the lowest standard deviation outcomes across all asset classes, creating the potential for “over-diversification” and therefore losing the benefit of low correlation when building portfolios. This can create correlations which always seem to pop up when least desirable.
EM investing
EM funds are investment products, but by no means could this product be considered an asset class. There is no familiar trait from one EM to another and it is not homogenous. The idiosyncrasies of growth and its sustainability, politics, risks, levels of state ownership have far more dispersion than experienced across DM economies. This dispersion has led EM in aggregate to disappointment for investors, despite clear evidence of strong GDP growth in some of these economies.
The growth across various countries within EM has been inconsistent due to the cyclicality of economies influenced by commodities i.e. Brazil, South Africa, Russia, Middle East or reliance on exporting (Mexico, South Korea, Taiwan).
Additionally, GDP growth doesn’t always correlate to EPS growth. Quite often, listed EM companies do not provide a true reflection of the local economy, which is driven more by its MSME’s that remain unlisted or the domain of local investors due to lesser regulation, lack of need for capital, compliance burden and lack of liquidity for larger institutional investors. Larger and more liquid stocks which tend to be the domain of EM funds can contain more state-owned enterprises, which can be inefficient and poor allocator of resources as well as larger more mature growth businesses, which have already experienced their S-curve.
Why do we invest in EM
Typically investors seek EM exposure in an attempt to access greater earnings growth, which is diverse to sources of earning growth in DM. Alpha attainable from investing in these markets should also be more abundant as you are ‘digging deeper’ into less efficient markets, with less broker coverage.
However, investing in EM as an asset class has ended up being a high beta play on investing in DM. Inevitably the exposure fares worse in downturns as US investors (the home of capital) repatriate funds during a flight to safety. As recession fears increase, commodity and export driven economies tend to be impacted more, than broad based and diverse economies. This high beta / correlated play tends to erode the benefits of investing in EM as an aggregate.
Considerations for investing for growth in EM
- Avoid passive market-cap investing, as this method washes out the correlation benefits of investing for in this segment – large, liquid globalised companies operating in the same revenue pools andsimilar investor bases, washing away localised correlation benefits.
- Identify markets with potential for robust corporate earnings growth given long-term secular fundamentals, where there is liquidity, breadth, diversity, regulation, as well as financial and investment infrastructure.
- Look for localised nuances and growing local market investor participation to drive diversification benefits and support when foreign investors repatriate
- Strong macro fundamentals and forex reserves can underpin a healthier currency
The case for adding India as a substitute for EM or to complement existing exposure
We expect this to be an easy conclusion to make over at least the rest of the decade for an Australian domiciled investor, given the following:
- High GDP growth relative to the EM basket – likely to be fastest growing major economy
- India’s corporate earnings has more or less matched nominal GDP growth over time, making its equity market ‘glidepath’ more predictable
- Local investors (in India) have become equivalent to global investors (market cap), making its equity market and currency less volatile. This was evident in 2022 as foreign investors sold out of India and it was met with local buying, keeping markets buoyant for most of the year.
- Steady and more predictable political regime and geopolitical situation
- Reforms undertaken and increasing capex/infrastructure over the past decade is likely to lead to rising productivity and GDP-per-capita
- Lower correlation to AUD based assets than EM equities or EM currencies
- Avoidance of exposure to China, which is likely to slow dramatically from its pace of growth over the last two decades
- India has an inverse relationship to commodities in comparison to Brazil, South Africa, Middle East, which tends to make it less correlated with AUD based assets
Evidence of this over the last 7 years
Based on the last seven years since our business has been in place, we note that the best return-for-risk combination (annualised return divided by standard deviation) comes from 85% MSCI World + 15% MSCI India. This was an improvement of the best mix of MSCI World and MSCI EM (94% MSCI World, 6% MSCI EM). The lowest risk portfolio is 50% MSCI World, 50% MSCI EM – however, whilst this reduced the volatility of the outcome through over-diversification, it also reduced the return potential.

Whilst the future is unlikely to look like the past, the expectation of earnings growth which keeps pace with India’s nominal GDP over time (expected to be around 10%), the low correlation of Indian equities with Australian equities and Global equities, will mean it is likely that Indian equities are a better fit/inclusion for Australian domiciled diversified portfolios seeking global equity market exposure, than broader emerging markets exposure from a risk-return perspective.
Our View Indian equity markets may be more volatile as a stand-alone allocation compared to EM equities (as you would expect), however its inclusion in a portfolio makes more sense for long-term investors in Balanced, Growth and High Growth options than investing in EM. It is simply a case of dollar cost averaging into a market which offers a compounding earnings growth story through its secular fundamentals of a large, youthful and employable population, which is likely to witness more sustainable growth over the next few decades in comparison to that witnessed by China.
The chart below shows that India’s corporate earnings growth has been far more resilient than the S&P500 over the last 30 years, whilst prices have been more volatile. Therefore allocating over time, with top-ups during global risk-off sentiment periods has produced a strong compounded experience.

Our Disclaimer:
Equity Trustees Limited (“Equity Trustees”) (ABN 46 004 031 298), AFSL 240975, is the Responsible Entity for the India Avenue Equity Fund (“the Fund”). Equity Trustees is a subsidiary of EQT Holdings Limited (ABN 22 607 797 615), a publicly listed company on the Australian Securities Exchange (ASX: EQT). The Investment Manager for the Fund is India Avenue Investment Management Australia Pty. Ltd. (“IAIM”) (ABN 38 604 095 954), AFSL 478233. This publication has been prepared by IAIM to provide you with general information only. In preparing this information, we did not take into account the investment objectives, financial situation or particular needs of any particular person. It is not intended to take the place of professional advice and you should not take action on specific issues in reliance on this information. Neither Equity Trustees, IAIM nor any of their related parties, their employees, or directors, provide any warranty of accuracy or reliability in relation to such information or accept any liability to any person who relies on it. Past performance should not be taken as an indicator of future performance. You should obtain a copy of the Product Disclosure Statement before making a decision about whether to invest in this product.
The India Avenue Equity Fund Target Market Determination is available. India Avenue Equity Fund’s Target Market Determination is available on our website: http://www.indiaavenueinvest.com/our-fund. A Target Market Determination describes who this financial product is likely to be appropriate for (i.e. the target market), and any conditions around how the product can be distributed to investors. It also describes the events or circumstances where the Target Market Determination for this financial product may need to be reviewed